Purple and green Intelligent Mapping™ Logo

DATA IS POWER

INTELLIGENT MAPPING™ DELIVERS SMARTER, MORE RELIABLE DATA TO FIELD ENGINEERS, OPERATIONAL TEAMS, AND C-SUITE DECISION-MAKERS.

Graphic showing bend radius violation detection icon and text in green.
Cloud icon with upward arrow next to the text "Cloud Based + CAD Integration" in lime green font.
Graphic displaying an upward trending bar chart with green bars and arrow, alongside the text 'Real-Time Reports + Dashboard' in bright green.

REAL - TIME ACCESS

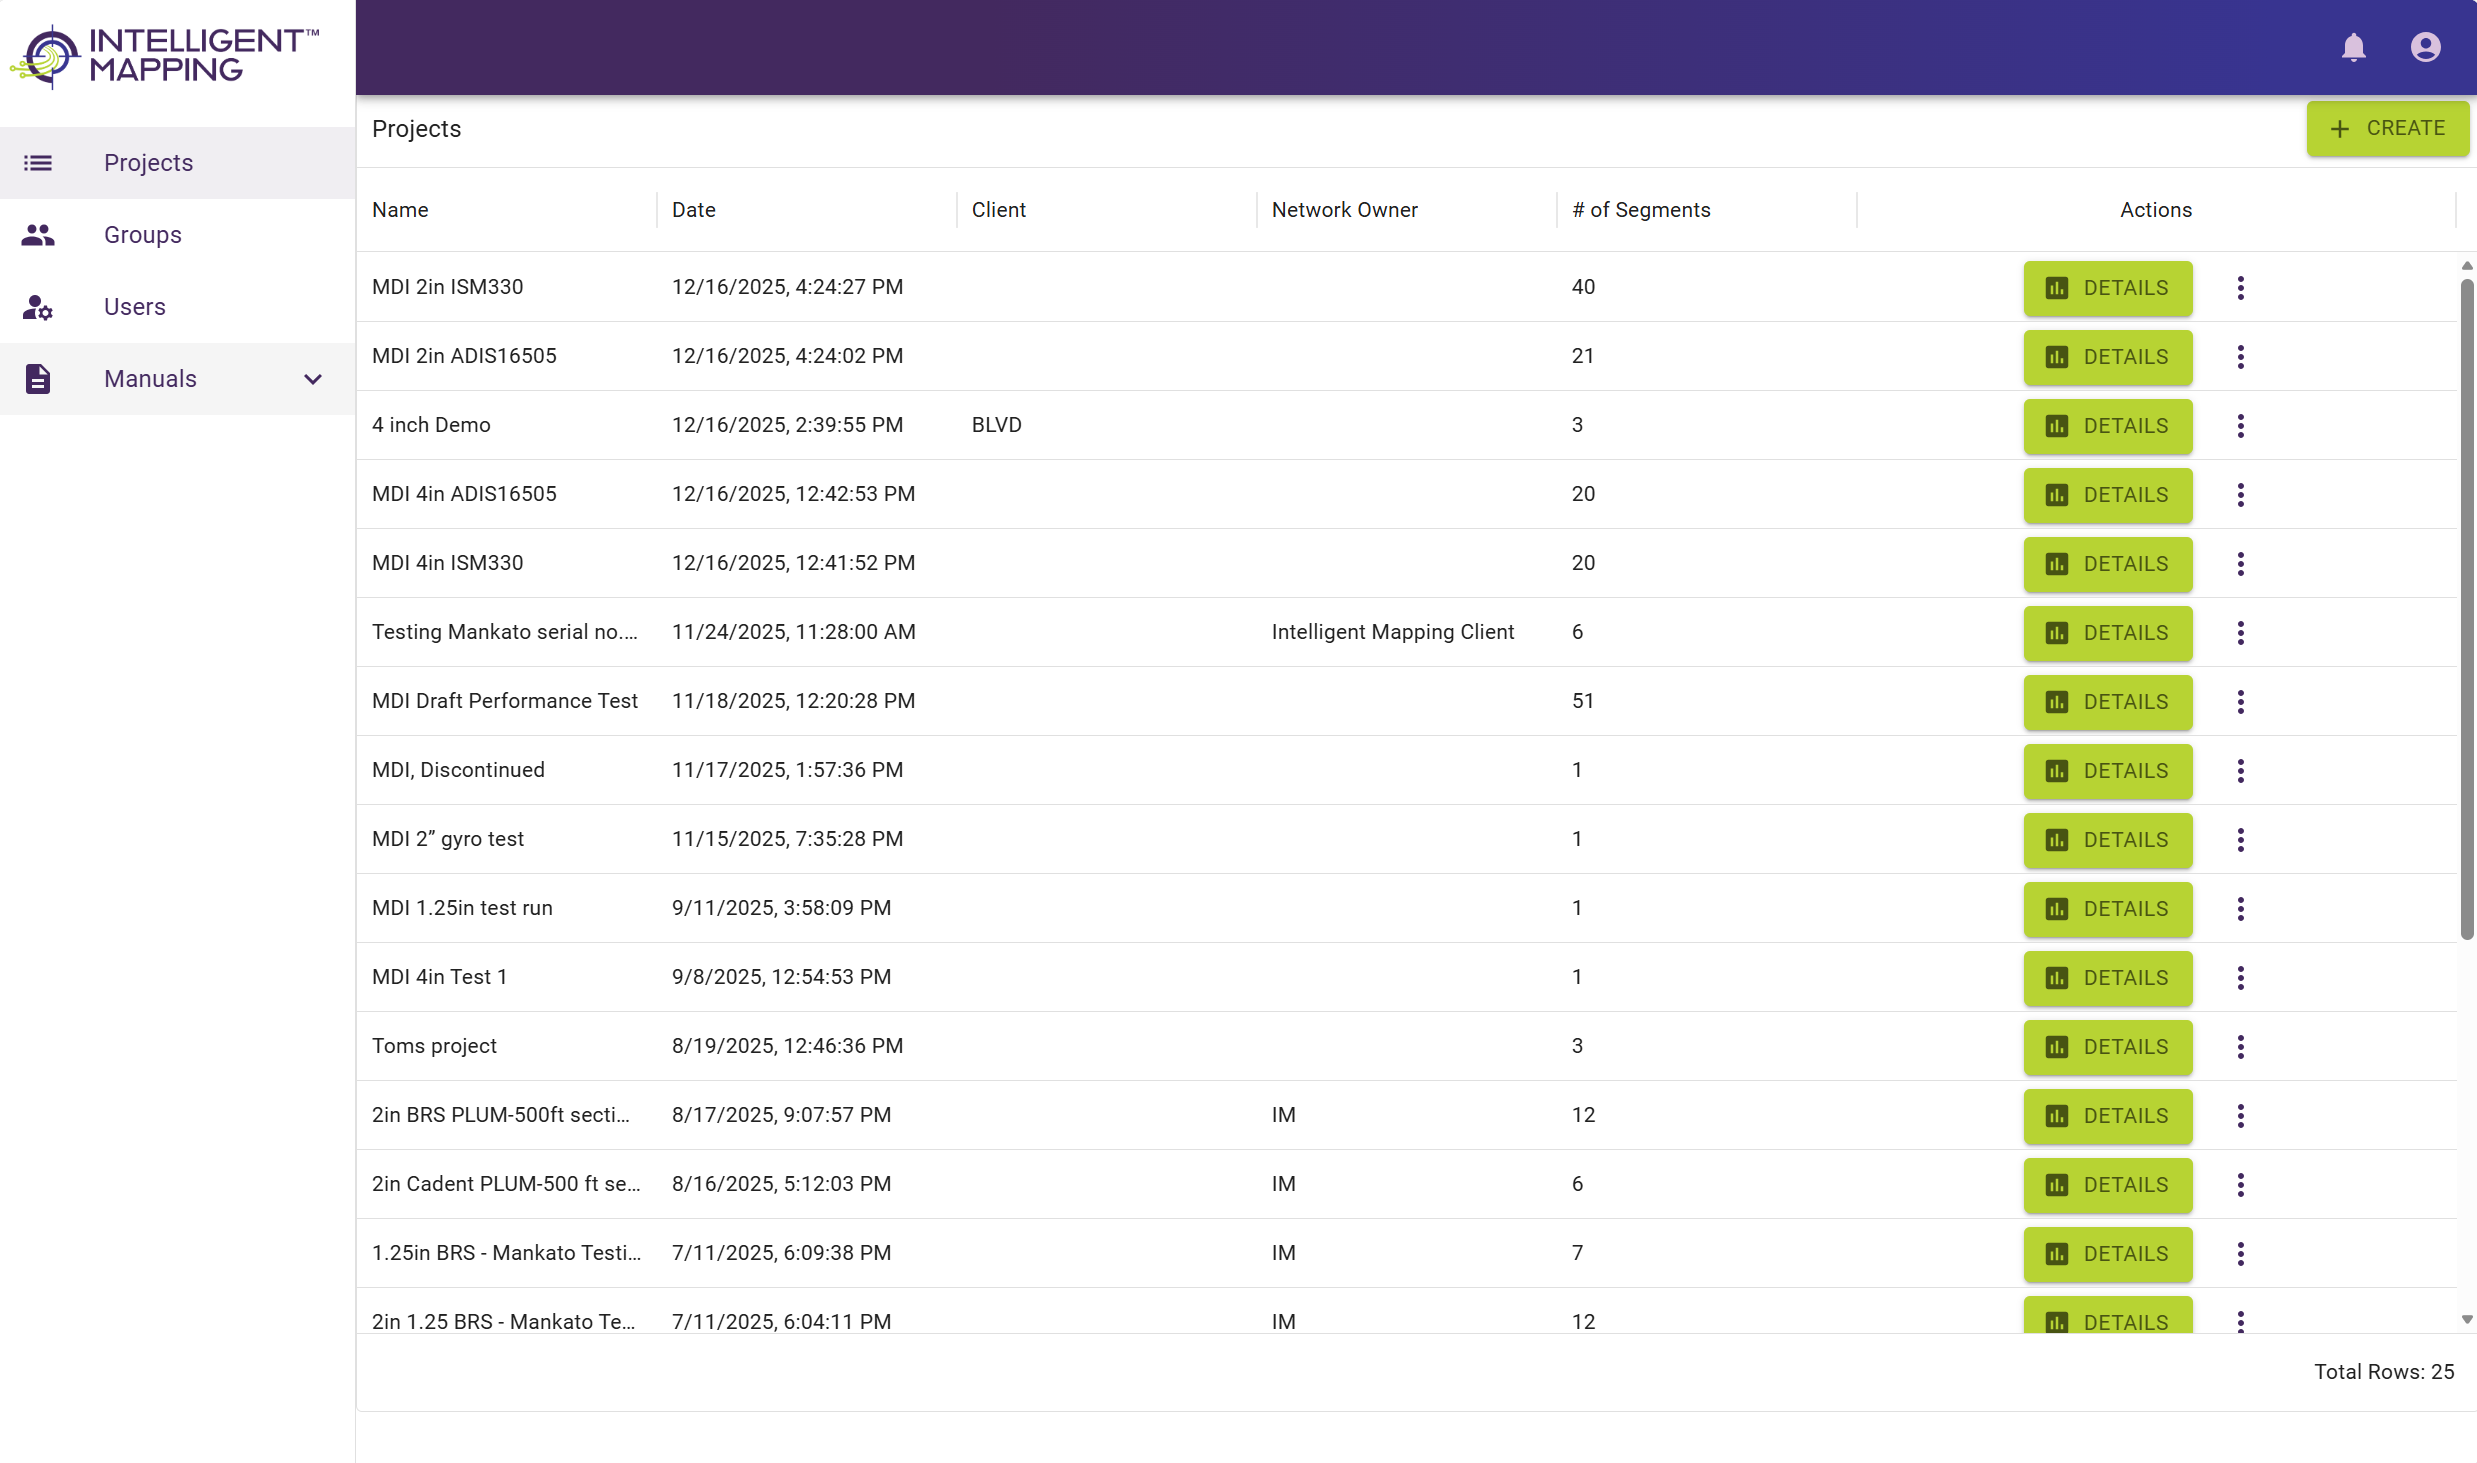
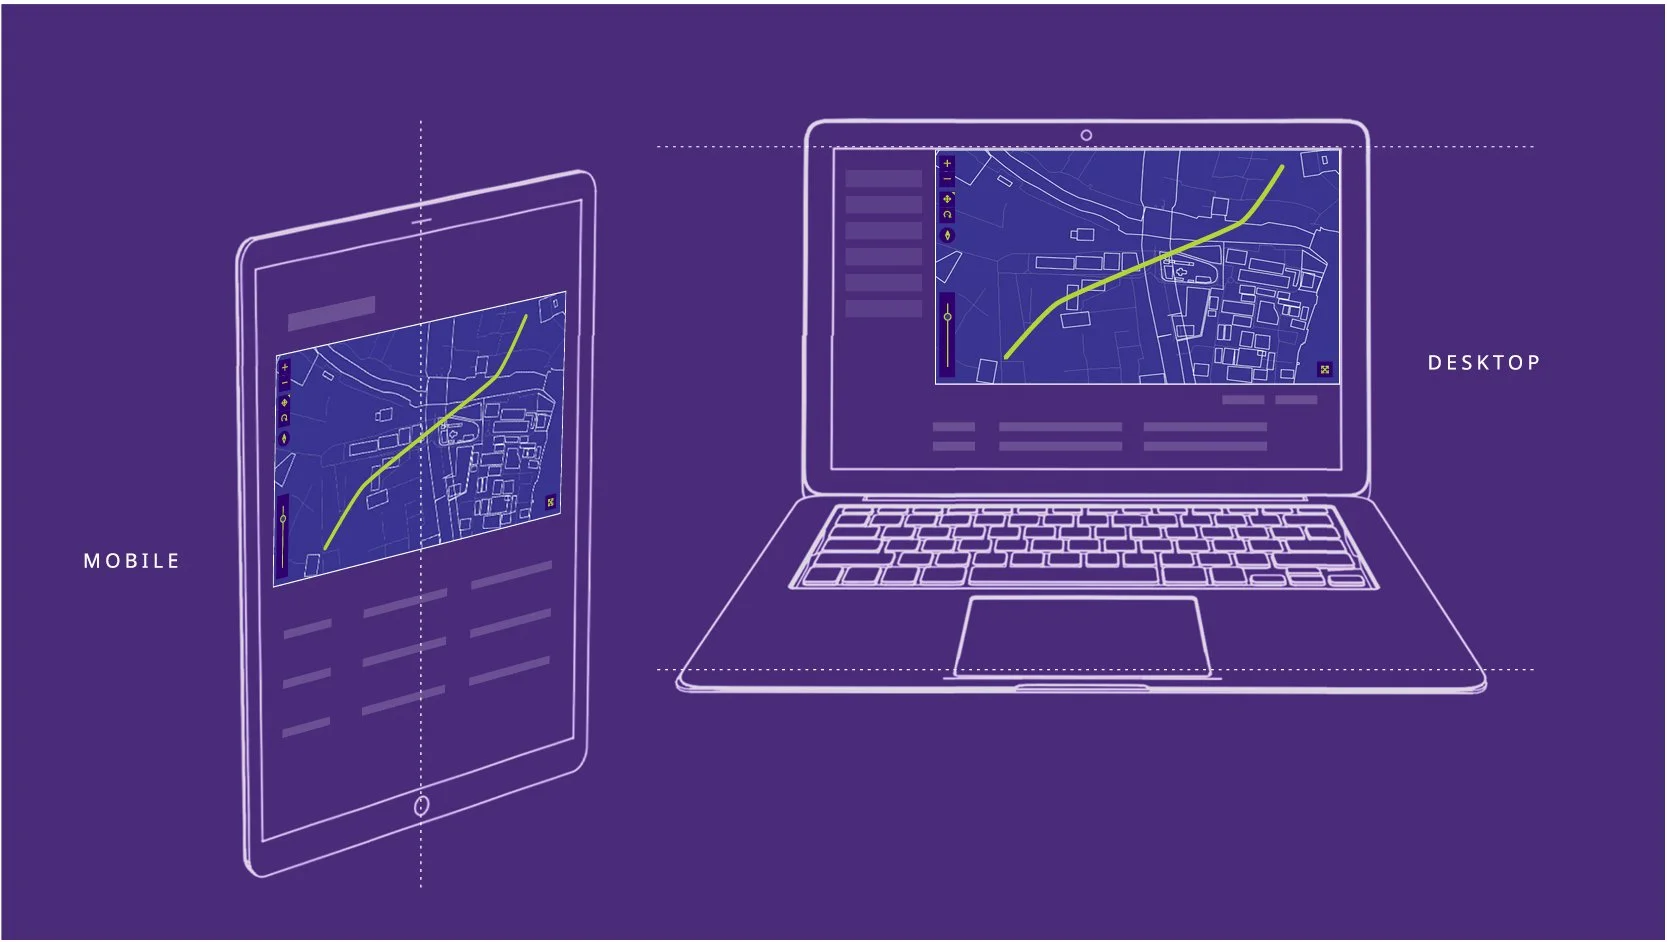
INTELLIGENT MAPPING™ SOFTWARE

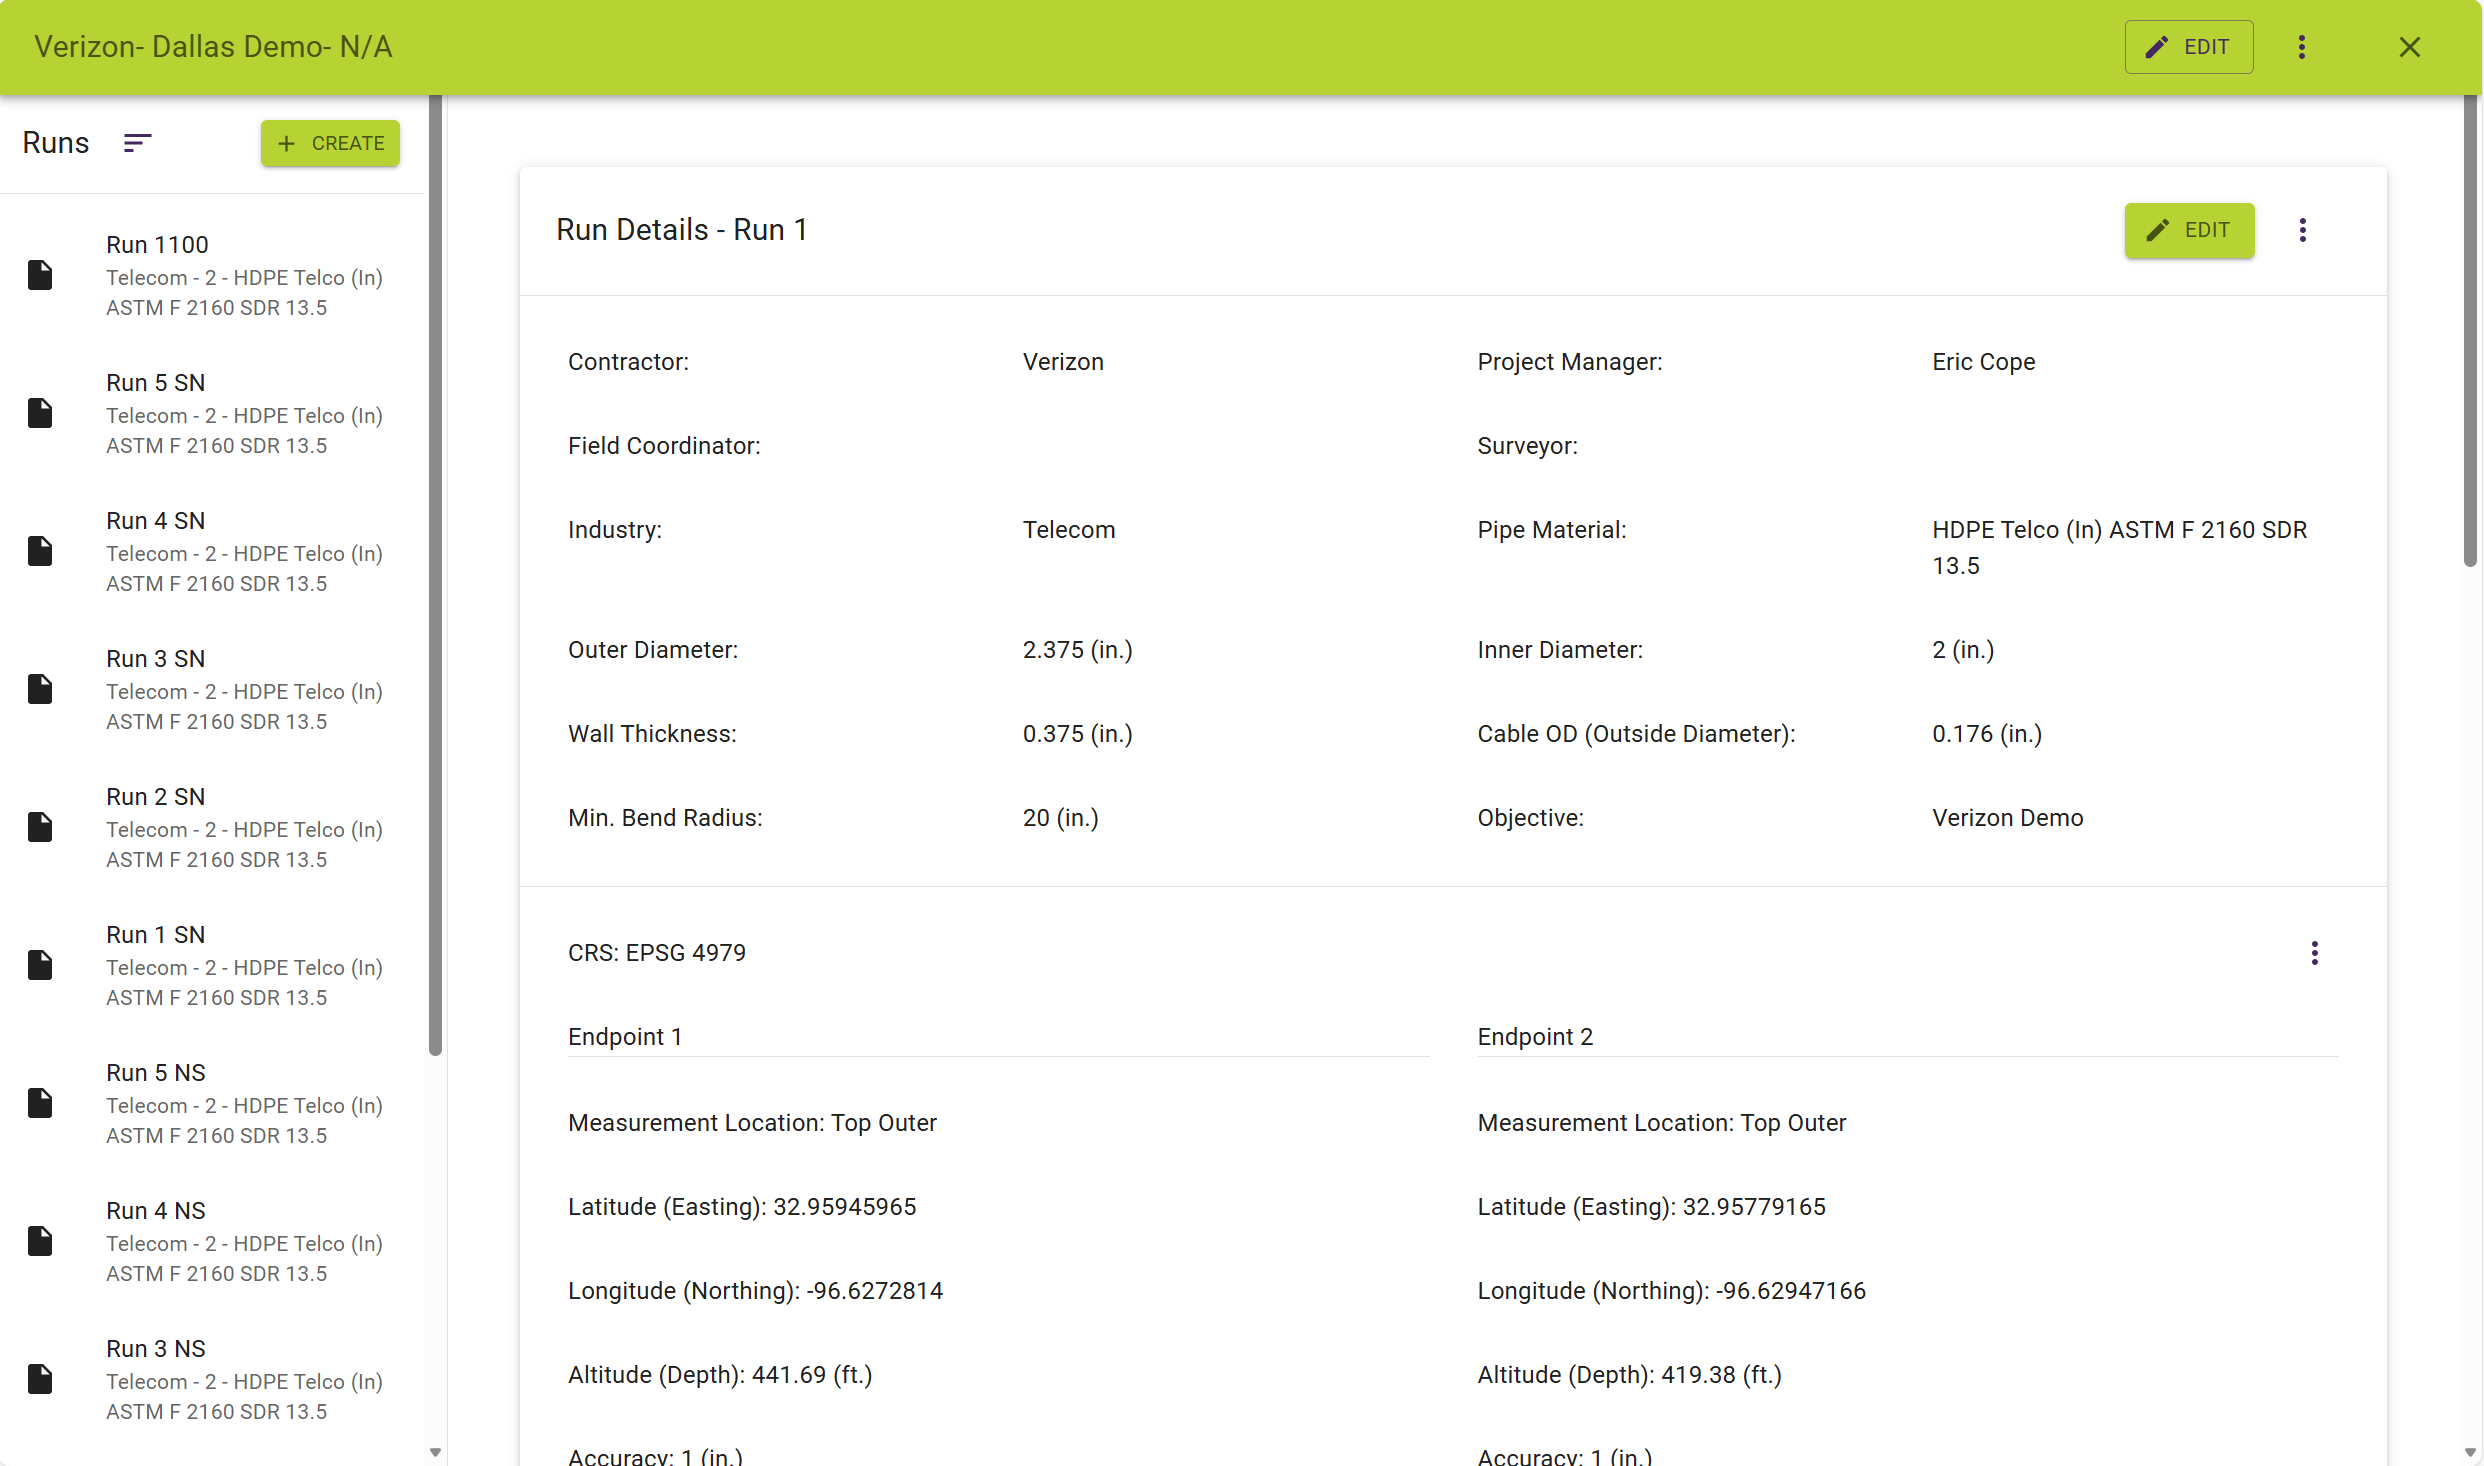
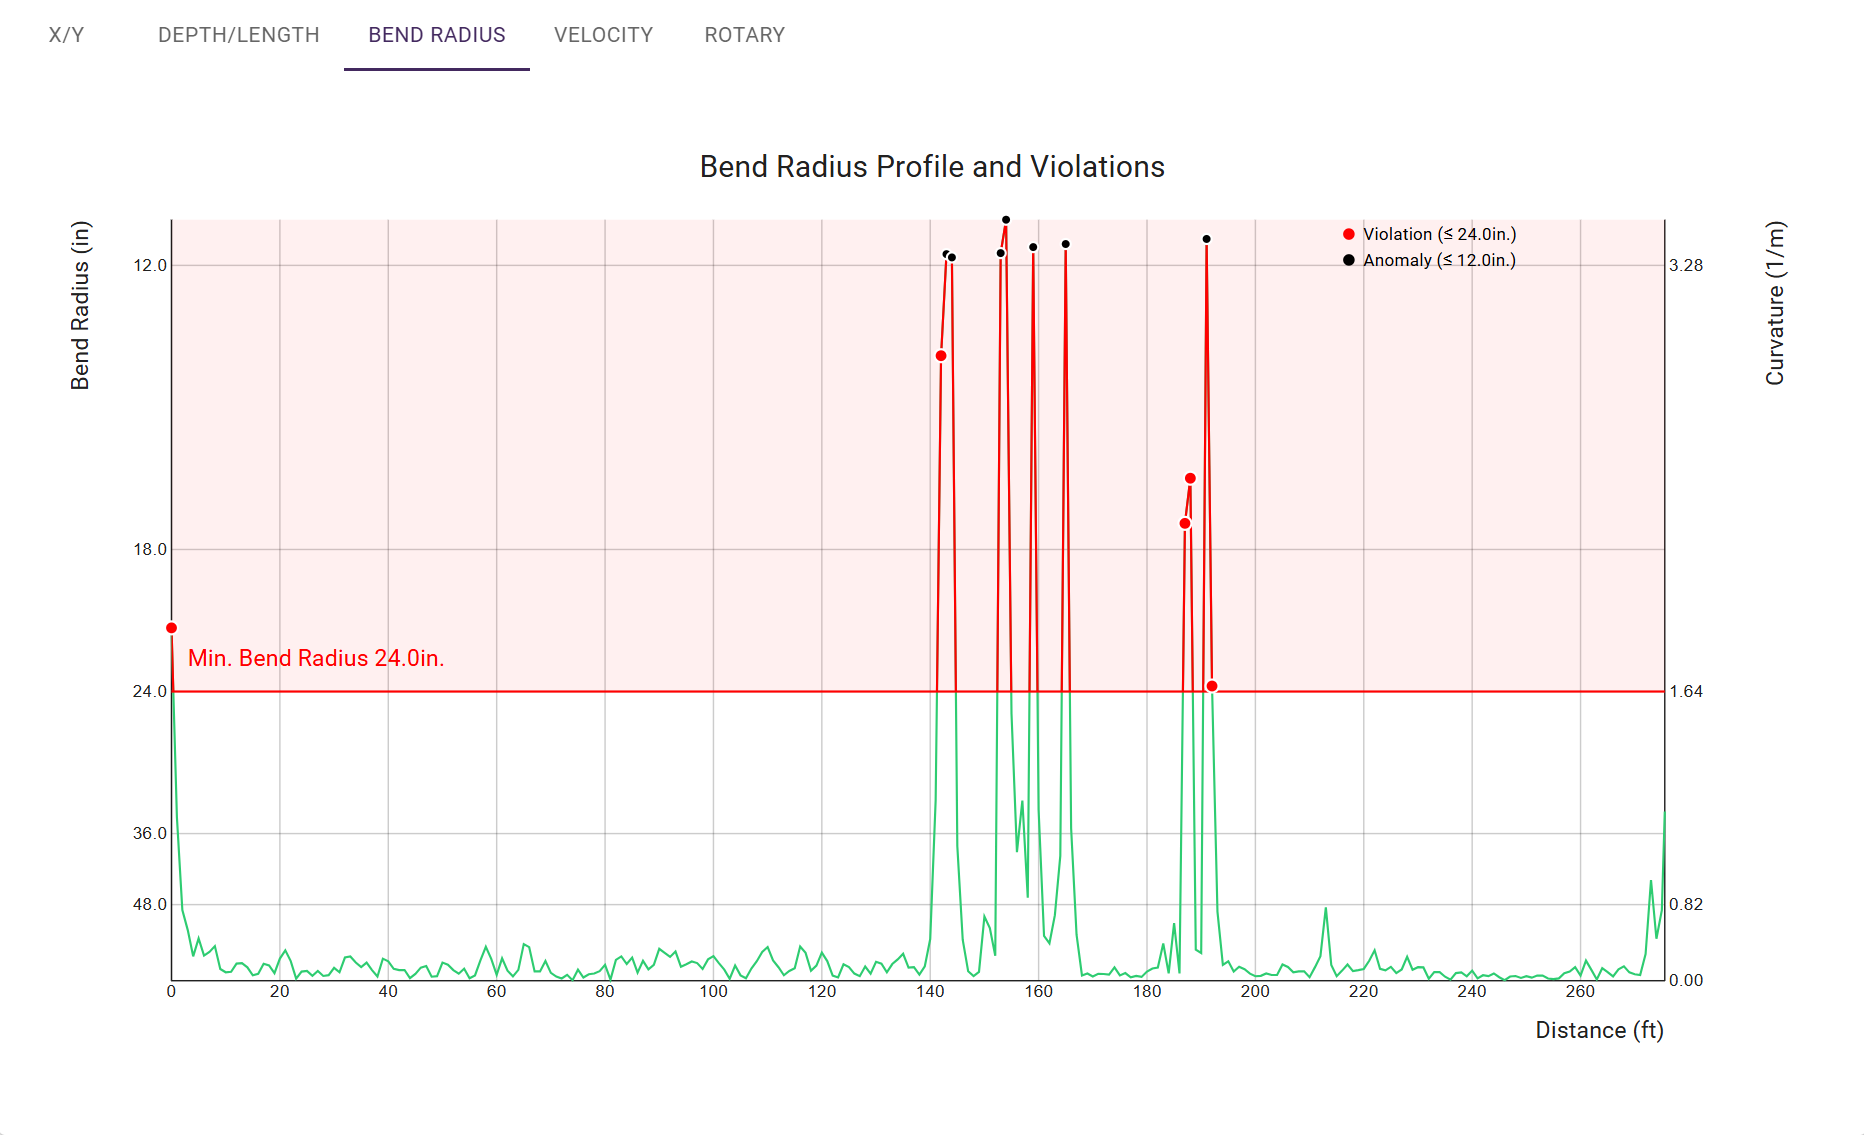
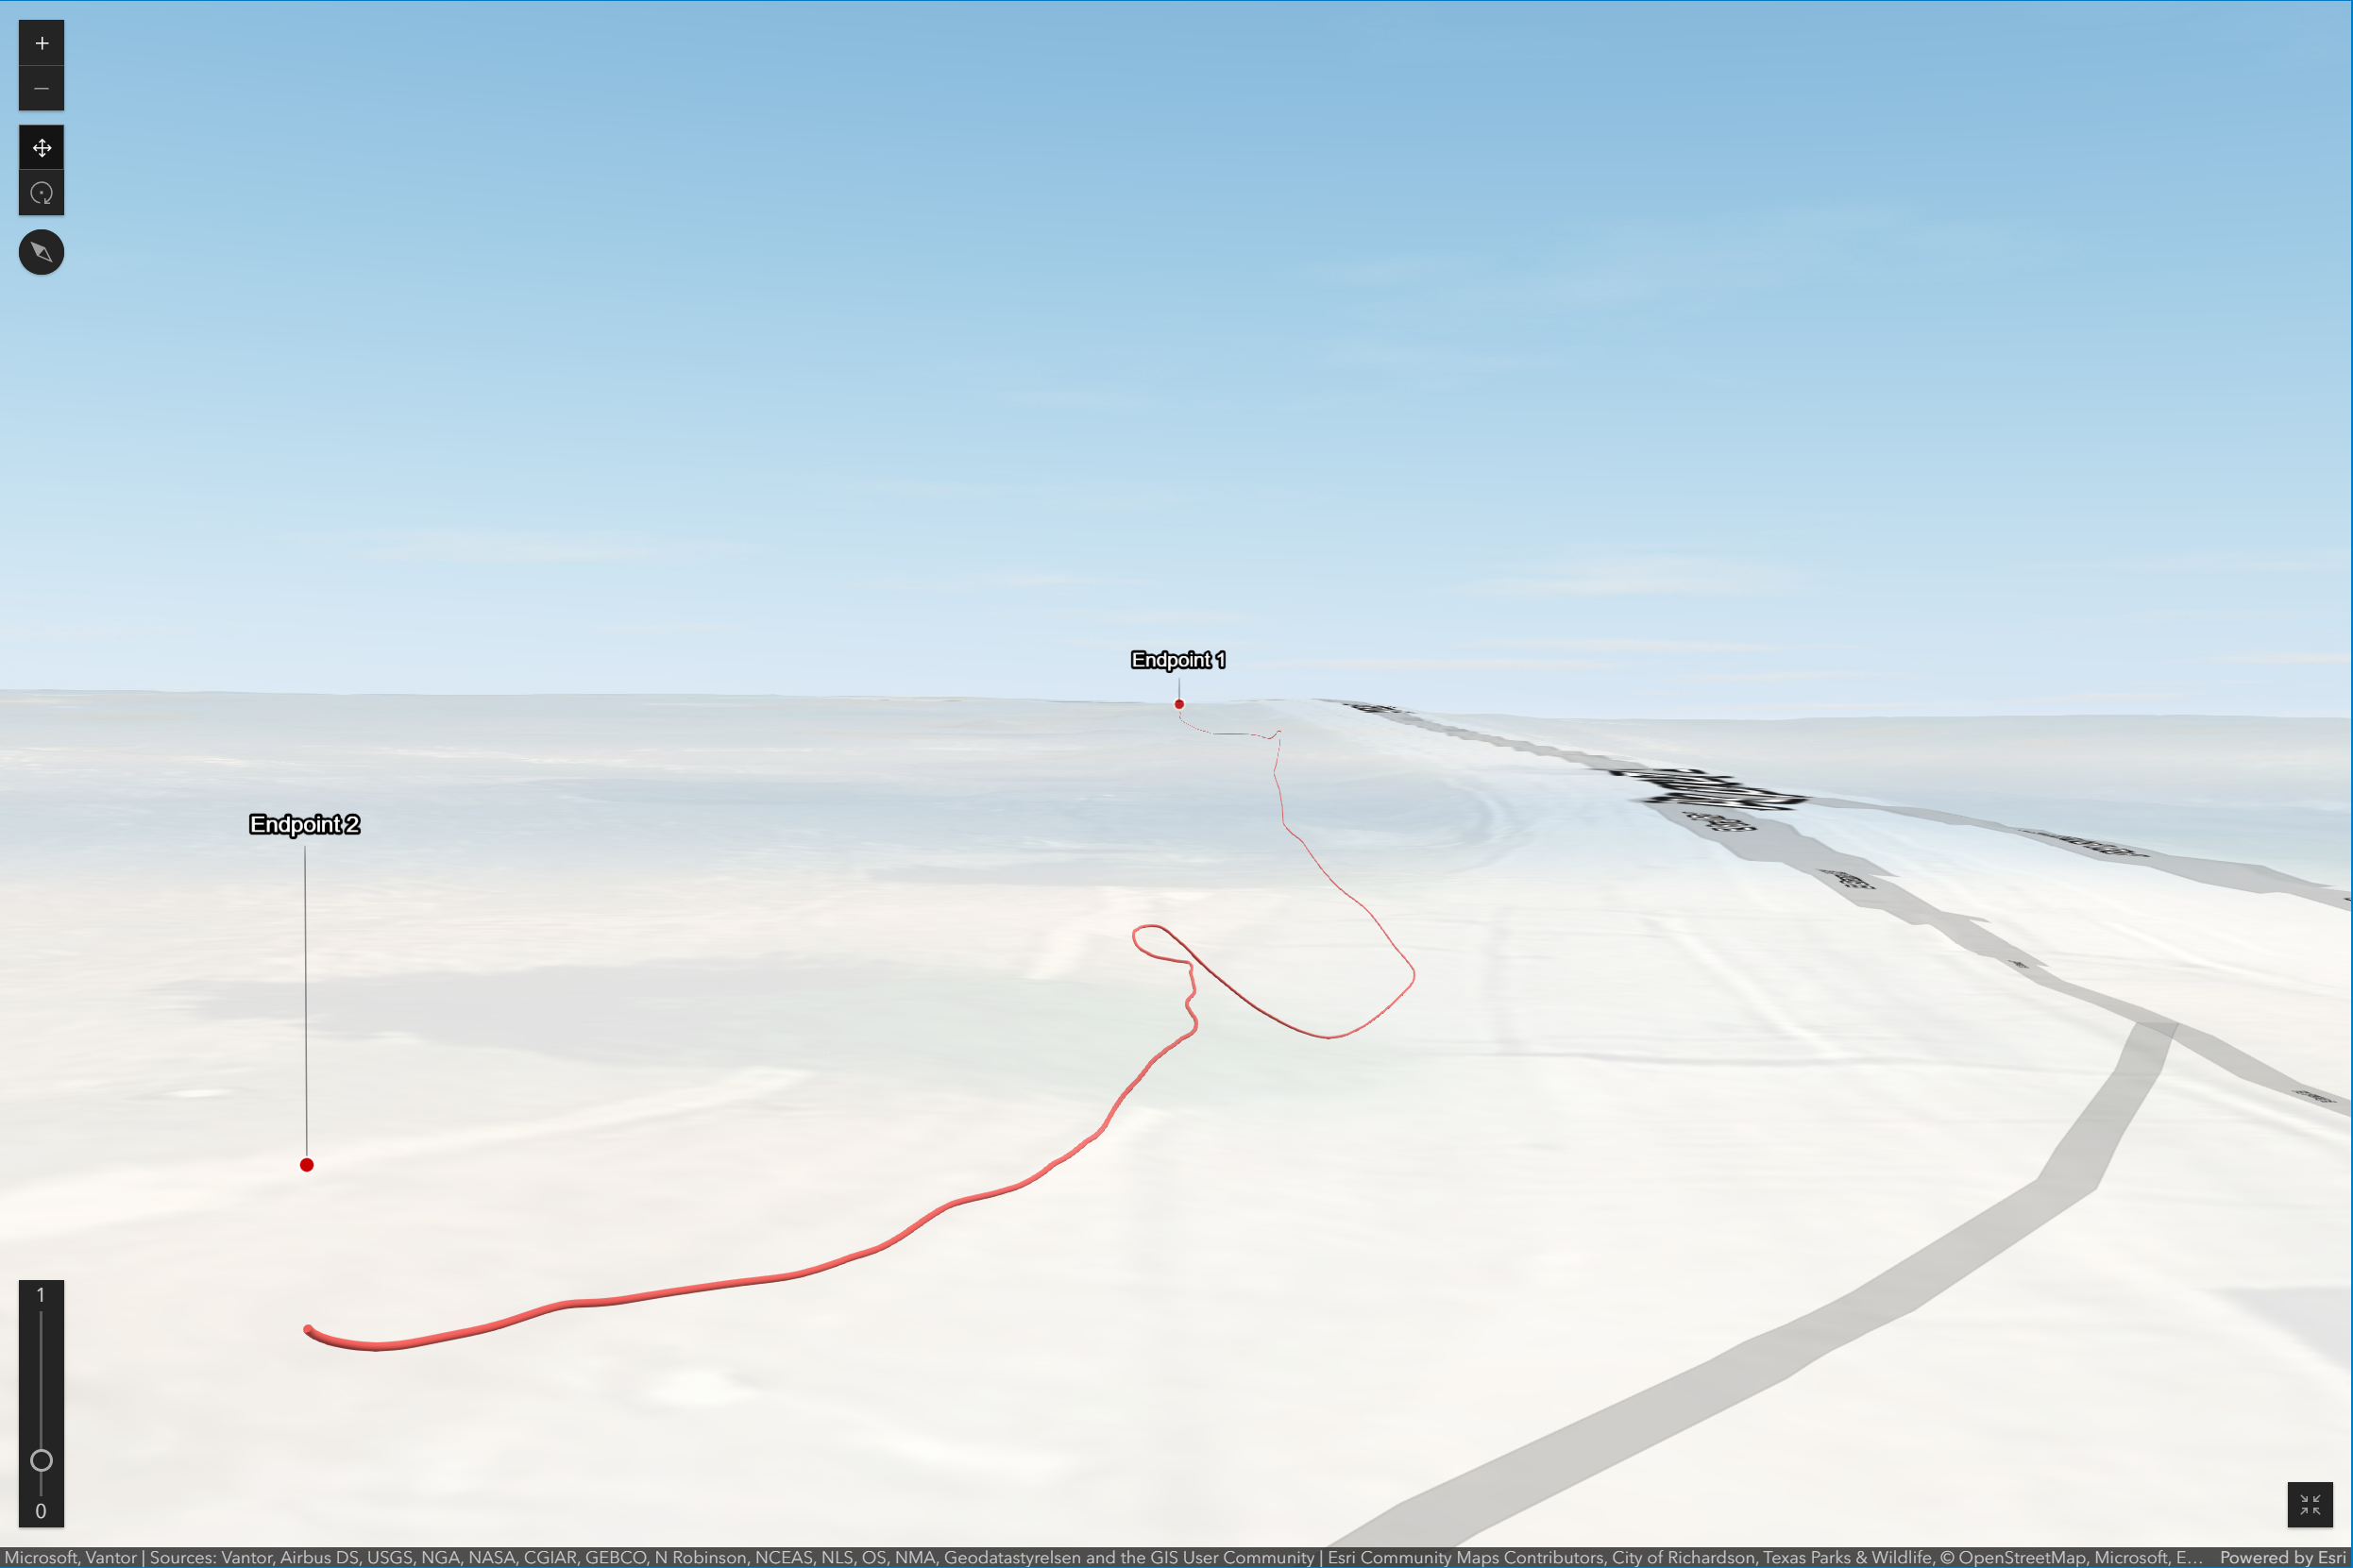
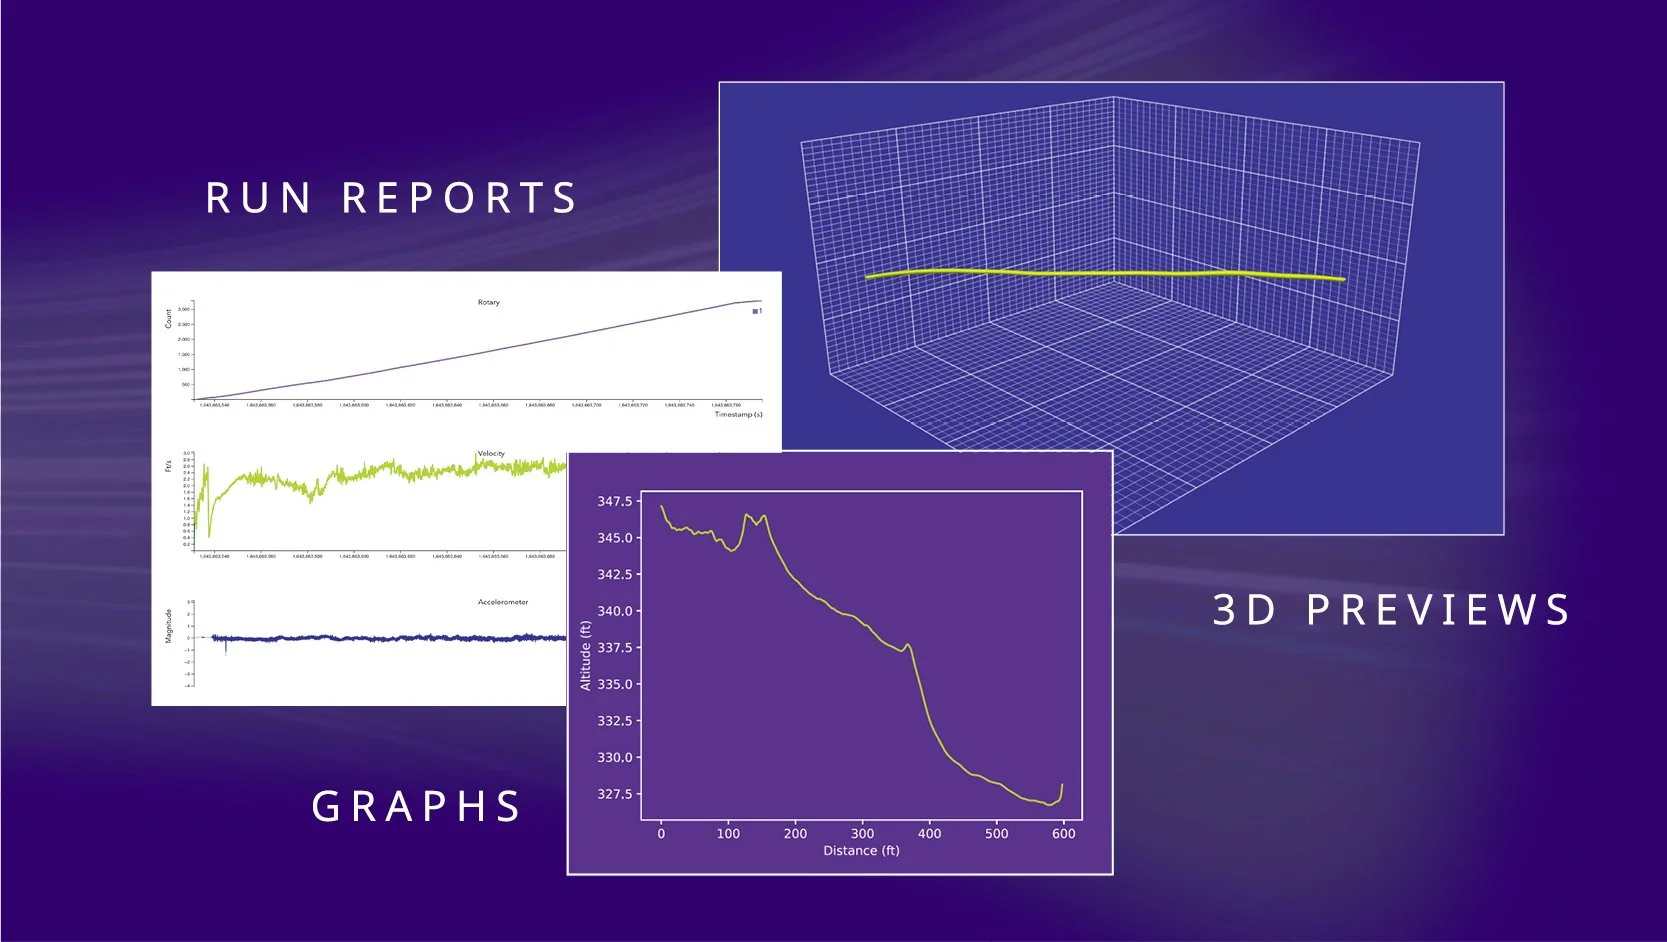
The Intelligent Mapping™ proprietary software is available for mobile and desktop and allows data centers and oil, gas, power, telecommunications, sewer, and water operators almost instantaneous access to mapping data. After the device has been pulled, run reports, 3D previews, and GIS-ready data is accessible where you need it — from the field to the boardroom.

A digital illustration showing a comparison between mobile and desktop devices displaying a map with a route. The left side features a mobile phone outline labeled 'Mobile,' with a map and route displayed. The right side features a laptop outline labeled 'Desktop,' showing the same map and route on the screen. The background is purple.
Diagram illustrating a pipeline route map, with a data table of coordinates and measurements, and specifications for high-density polyethylene (HDPE) pipeline material, length, diameters, wall thickness, and bend radius.
A digital presentation slide displaying reports, graphs, and 3D previews related to data analysis. The slide includes a line graph of torque, a line graph of velocity, a line graph of accelerometer data, a 3D wireframe model, and a line graph of altitude over distance. The words 'RUN REPORTS,' 'GRAPHS,' and '3D PREVIEWS' are visible on the slide.
A stylized logo featuring a fingerprint within a crosshair or target design with a tech-inspired feel.

EASE OF USE

THE INTELLIGENT MAPPING™ ADVANTAGE

The Intelligent Mapping™ data gathering process is streamlined and efficient, allowing you to speed up your back-office processes and give your organization real-time access to your infrastructure data.

Screenshot of a project management dashboard from Intelligent Mapping, showing a list of projects with columns for name, date, client, network owner, number of segments, and actions, including buttons labeled 'DETAILS' in green.
Graphic box with the text "Data is immediately available in the field before it is uploaded to the software for processing" inside a colorful border.
Screenshot of a project management platform showing details of a telecom duct installation, including pipe dimensions, project objectives, and location coordinates.
Graphic box with the text 'Data is compatible with GIS-ready platforms,' on a white background with yellow and green lines.
Graph titled 'Bend Radius Profile and Violations' showing data points of bend radius on the y-axis and distance in feet on the x-axis. Red and black dots indicate violations and anomalies, with a red line marking a minimum bend radius of 24 inches.
Graphic box with the text 'Run reports, 3D previews, and GIS-ready data are accessible, streamlining backroom processes.'
A 3D map showing a path from Endpoint 2 to Endpoint 1, with the route marked in red, set against a landscape with a blue sky.
Graphic box with the text explaining intelligent mapping software that connects to devices through a single pipe or conduit to collect report data.

READY TO MAP SMARTER?

TURN UNDERGROUND UNCERTAINTY INTO DATA-DRIVEN CONFIDENCE